Menu
Table of contents
With Google Analytics, you can gain insight into the behavior of visitors to your website and find out the number of visitors to your website. These insights can then be valuable in making choices.
The most important metrics are: bounce rate (and on the other hand, engagement rate), page views, average session duration on the website and average engagement duration per session. And why are these metrics most important?
I'm going to explain that to you now!
Back to the beginning...
I hear you thinking: Google Analytics, what was that again? Google Analytics 4 is a program from Google that tracks and provides insight into the behavior of visitors to your website.
The possibilities are staggering, and to give you an idea of what Analytics looks like, I'll show you a screenshot now:
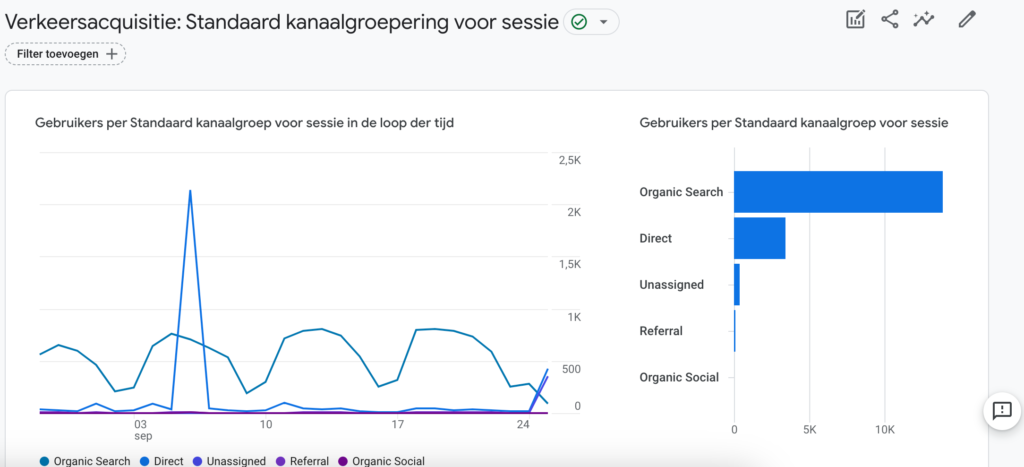
Now you may be startled by all the data, numbers and possibilities. I understand that, but it is totally unnecessary.
In fact, I'm going to tell you what the 4 most important statistics are from Google Analytics 4.
Before I start explaining those to you, I also want to share my Google Analytics 4 podcast episode. Because that's definitely what you need: podcast.
Page views
A page view refers to the retrieval and display of a Web page. Each time a page is requested, such as while visiting a website where multiple pages are viewed, it is considered a page view.
In addition, page views are also tracked when the same user views a single page multiple times.
Tips to improve the number of page views per session:
To get you started, we have a few concrete tips for improving page views per session:
- Place links in the text to relevant articles/pages within the website
- Add action buttons
- Show relevance information (Visitors also viewed, relevance blogs etc.)
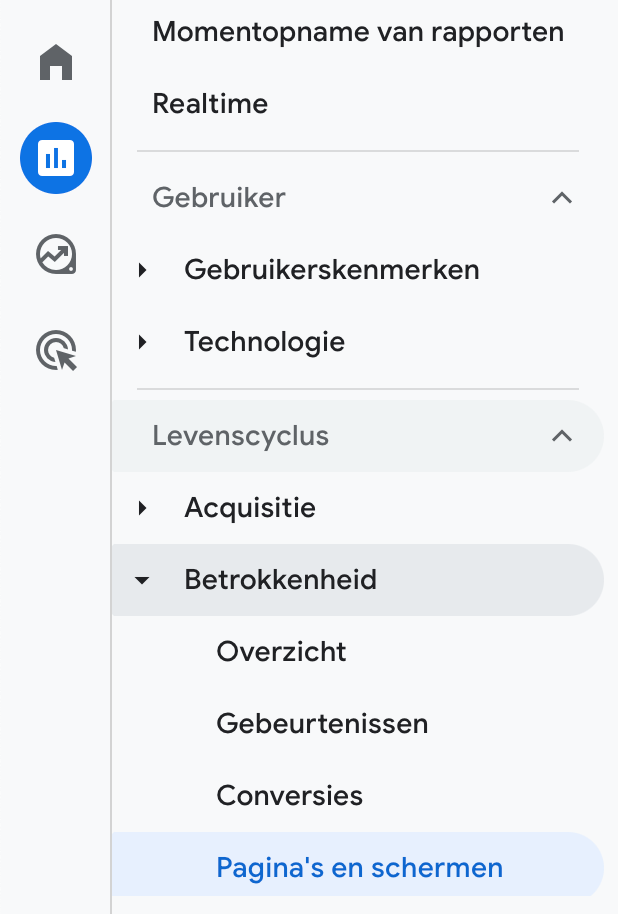
You can find the overview of the number of page views under Reports > Lifecycle > Engagement > Pages and screens
Average session duration
Average session duration means: how long, on average, a visitor visited your websites. Average session duration often goes hand-in-hand with the number of pages per session.
When someone visits many pages, they generally spend longer on your website as well. And you guessed it: when someone spends a long time browsing your website, they generally view many pages.
So the average session duration also says something about how interesting your visitor finds the content.
Therefore, there is also no ideal average session duration. It depends on the type of website and what kind of content there is on the website.
Tips to improve average session duration:
- Place links in the text to relevant articles/pages within the website
- Add action buttons
- Show relevant information (Visitors also viewed, relevant blogs etc.)
- Make use of video
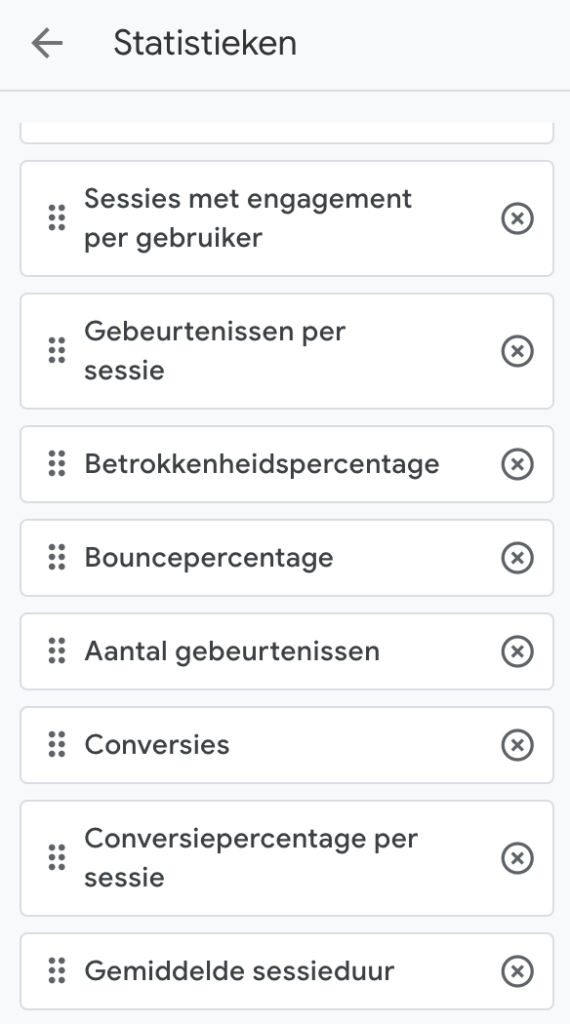
You can find out the average session duration of your website by adding this value as an extra column to a report. The example below shows how I did this at Acquisition > Traffic Acquisition:

By clicking on the pencil at the top right, you can customize the report. You will then see a screen with multiple columns. Adding average session duration as a value to the report here will display this statistic as an additional column:
Bounce rate
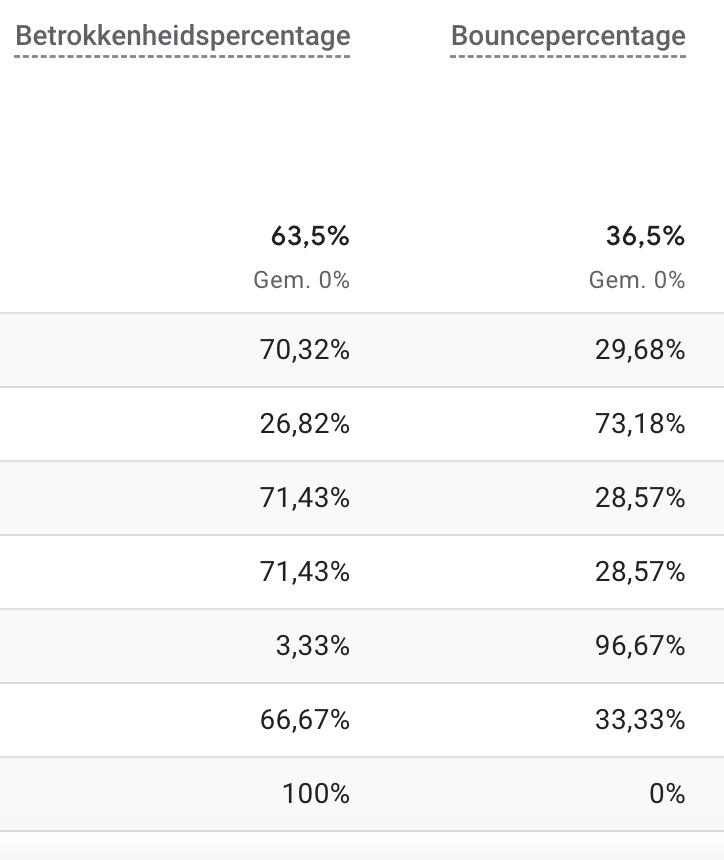
Bounce rate means: the percentage of visitors who leave the website without having engaged. So a high bounceperctage means that something is not going right.
Your website is not working properly, your content is not relevant, or something on your website scares off visitors. Therefore, a high bounce rate is always inherently bad.
Bounce rates are also often industry related. In the news business, the bounce rate is generally higher than other industries.
This has to do with people scanning the article quickly and then clicking away again. Therefore, it is also always good not to look at the bounce rate of your entire website, but to check the bounce per page.
Tips to lower bounce rate:
- Provide clear action buttons
- Test pop-ups
- Reduce page/website load time
- Improve your website for mobile users
- Design the 404 page properly
- Optimize content
- Place links in the text to relevant articles/pages within the website
- Provides the visitor with a search function
Finding out your website's bounce rate can be done at Acquisition > Traffic Acquisition, among other places. You may not yet see a bounce rate in the columns. Is this the case with you? Then customize the report with the pencil at the top right and add the bounce rate as a value.
Average engagement time per session
It is particularly interesting to note that this allows you to measure how long a Web page stays on view during a session by the user. An important rule of thumb should be that the more content a page has, the longer the average engagement time per session should be.
This provides an opportunity to estimate whether your content matches the average engagement time per session. If your pages are brimming with information, but users spend only a short amount of time on them, that may indicate a problem.
However, it is important to realize that users generally spend less time on a page than the writer himself might think beforehand.
Tips to improve average engagement time per session
- Provide valuable content
- Improve your positioning
- Handle clear Call to actions
- Minimize session duration thresholds
- Commit to internal linking
- Use other content as well
Here are the 4 most important statistics from Google Analytics.
Don't have Google Analytics 4 on your website yet, but would like to?
Then contact me or read my blog explaining how to install Google Analytics 4 yourself.
This article was written Feb. 22, 2021 and updated Sept. 26, 2023.
What are you measuring with Google Analytics?
With Google Analytics, you can measure how many visitors your website has and how they interact with your pages. For example, you can see how long they stay on a particular page, where they click through to and where they leave. But also whether they contact you, subscribe to your newsletter or buy a product!
Where can I find the most important statistics in Google Analytics?
In Google Analytics 4 (GA4), you will find the most important statistics under the reports heading. For example, under Acquisition > Traffic Acquisition > you will find the average engagement time per session and the bounce rate.
What data does Google Analytics collect?
By default, Google Analytics collects location data in personal data like the IP address of website visitors. So you must also comply with the AVG/GDPR if you use Google Analytics. It also collects usage data from your website: which pages people view and how they interact with the content on those pages.





Written by: Daniel Kuipers
Daniel is the founder of Online Marketing Agency. He constantly scours the Internet for the latest gadgets and tactics and blogs about them in understandable language. Well, sometimes.