Menu
Table of contents
Before we begin
When you first use Data Studio you might get a little overwhelmed.... Many options, many possibilities and no clear starting point.
That makes it very difficult to get off the ground. Therefore, my first advice is that you start watching YouTube tutorials, reading blogs and possibly downloading an e-book on Data Studio before you get started.
So this is not a complete guide, just 7 handy beginner tips to get you started. On to tip 1!
Tip 1: Think about who you are setting up the Data Studio for
Before starting to think about the content of the Data Studio, it is important to ask yourself who you are creating it for.
Do you make it for yourself, do you make it for the e-commerce manager, for an entrepreneur who is a customer of yours or for internal use?
In fact, depending on the answer to that question, you can determine what the level of the Data Studio should be, how deep you should go, and all the information it should contain.
After all, an entrepreneur who is not versed in marketing does not need to know what the bounce rate was for page X. He or she mainly wants to know how many leads and sales it generated.
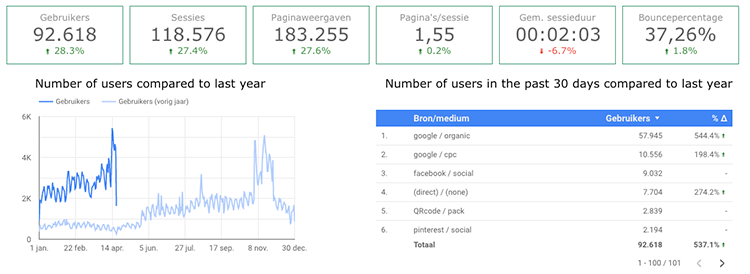
Tip 2: Determine what goals you want to focus on
Tip #2: Decide carefully what goals you want to drive. With the majority of my clients, we target leads, customers or sales.
So for example, clicks on email address, completed contact form or quote requests. After all, these are numbers that determine whether the marketing has been a success.
But then also think carefully about whether you want to show data from all channels or only within search engine optimization, for example. Make the goal as specific as possible and consider what you or your company is responsible for.
This is a direct extension of tip #1, as this information depends on your target audience. Also, be sure not to be afraid to ask your boss or client what kind of numbers they are driving.

Tip 3: Determine which indicators you want to provide insight into
We'll assume for now that the goals are, for example, quote requests and revenue. Those are both very specific and there's no arguing with that.
The next step is to determine what data and figures are supportive of the previously stated goals. In other words, the indicators.
This could include:
- Number of visitors
- Conversion rate
- Bounce rate
- Average time on page
- Exit rate
These are the numbers that can determine why you are doing so well or poorly. Are you getting a lot of inquiries within your website? Then chances are you have a lot of visitors and those visitors are also good quality
Do you sell a lot of products within your website? Then chances are your website is well set up in terms of conversion.
And in case you don't make many inquiries and don't sell many products, you can start looking at indicators :-).
Tip 4: Keep it simple. Don't make everything measurable
A common mistake I often see is that people want to have as much data insight as possible. Their Data Studio then consists of more than 5 tabs and you can no longer see the numbers through the graphs.
In my experience, Data Studio is the way to go for people who don't want to poke around in Analytics. Too many numbers and dings make it confusing, causing people to drop out and not read your reporting.
Therefore, always keep it as simple as possible. Basically, always use more one tab and never more than two.
They sometimes say "writing is deleting," but reporting is also deleting.
Tip 5: Work from an existing template
My biggest challenge with Data Studio was that I didn't know where to start. I started cobbling something together myself and wasn't thrilled with the results.
Until at some point I was browsing the Internet and saw templates for Data Studio everywhere. Templates abound, so always start there!
Go fiddle with those. Because those are full of information and that's where you can really learn to understand Data Studio and how it works.
The downside of templates? It's always just not what you're looking for, but when you're just starting out with Data Studio, that's not the problem.
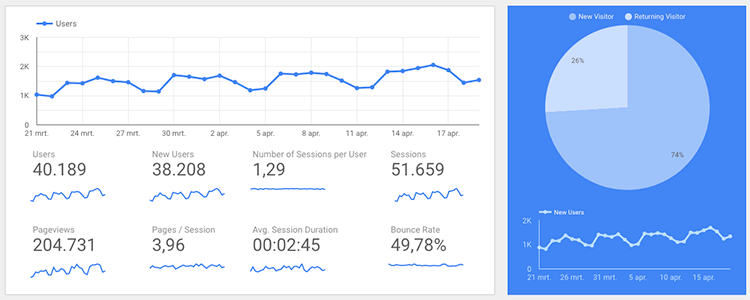
Tip 6: Copy tables, charts and your document
Something that made me understand Data Studio very quickly was copying charts and tables and then adjusting dimensions and statistics.
With a few button presses, you get to see completely different information. You'll find out in a playful way which combinations don't work and which combinations are very useful.
Adjusting the dimension and statistics can be done on the right, when you have clicked on a chart or table.
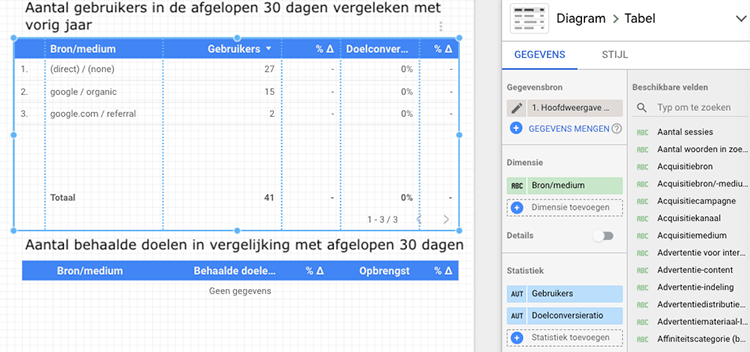
Now you may be wondering "so how do you copy a table, chart and the entire Data Studio?".
Copying and graph or table can be done easily by using CTRL + C and then CTRL + V. Or of course command + C and command + V on Mac.
Copying the Data Studio can be done by clicking on the copy icon when you're in view mode. And that's the second icon from the left:

Tip 7: Make your Data Studio easily shareable
Once you have applied all of the above tips, there is only one task left to accomplish: sharing your Data Studio. This can be done in two ways:
- Adding someone to the document
- Forward a shareable link.
Personally, I'm most a fan of option two, but please explain both.
When you click "Share" at the top, you will see the screen below.
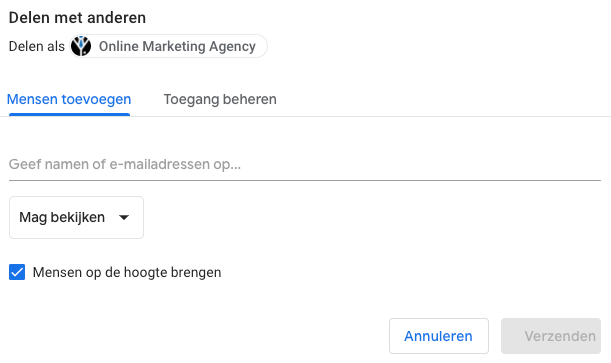
Enter the email address of the person in question here and click "Send.
Like me, do you want to share a shareable link? Then click "Manage Access" and make sure it says "anyone with the link can view this" in the upper right corner. This is very important!
Then copy the link and share it with your stakeholder!








Written by: Daniel Kuipers
Daniel is the founder of Online Marketing Agency. He constantly scours the Internet for the latest gadgets and tactics and blogs about them in understandable language. Well, sometimes.