Menu
Table of contents
But how do you check if everything is measured correctly within Google Analytics 4? That's what Google has introduced the DebugView for.
In this blog article, read everything you need to know about the Google Analytics 4 DebugView.
Where can you find the DebugView within Google Analytics 4?
You can find the DebugView within Google Analytics 4 by clicking on the cog in the lower left corner. Then you need to look under the right menu of 'Property' and there you will find 'DebugView'.
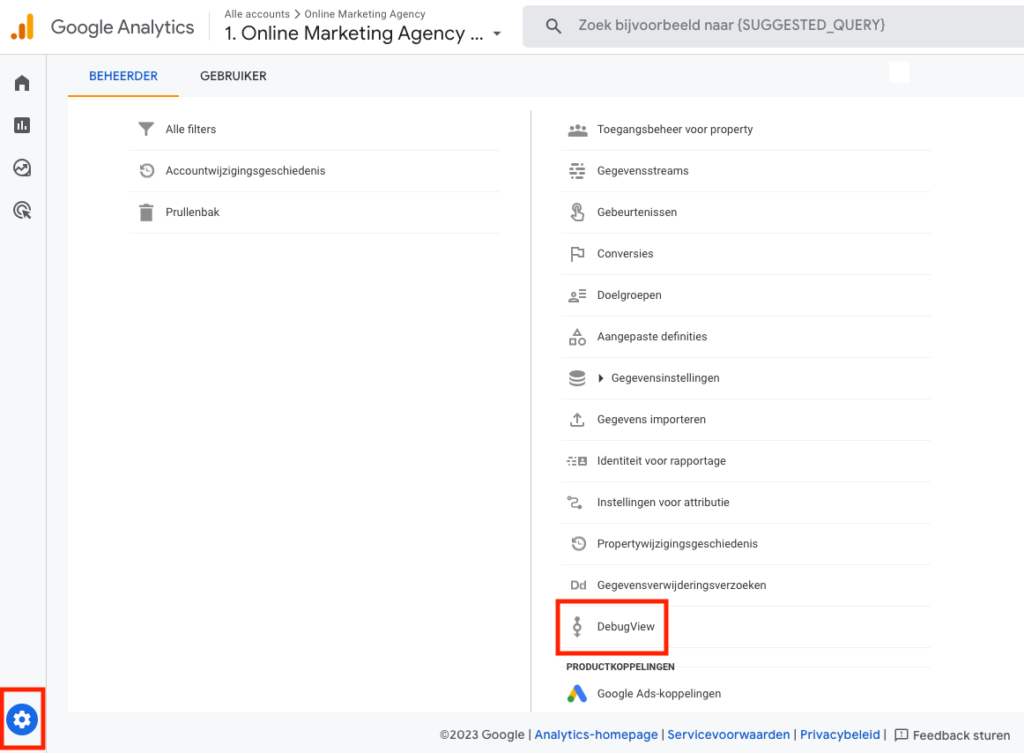
If you go here then you will most likely not see debug data back yet. How we get this insight I explain below.
GA4 DebugView overview
Basically, the DebugView consists of the following elements:
- 1. Minute Stream
- 2. Second Stream
- 3. Top events
- 4. Device troubleshooting
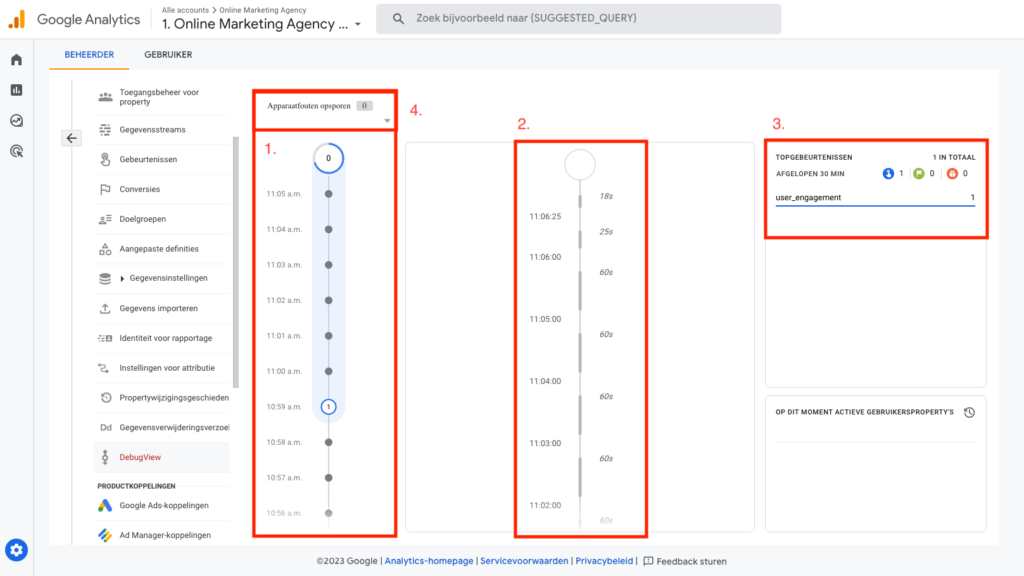
1. Minute Stream
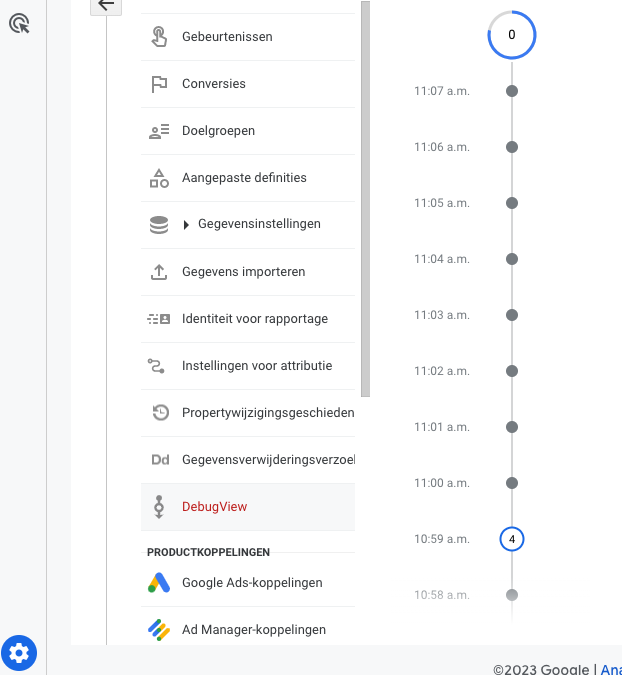
In the minute stream, you can see the number of events that took place per minute over the past 30 minutes.
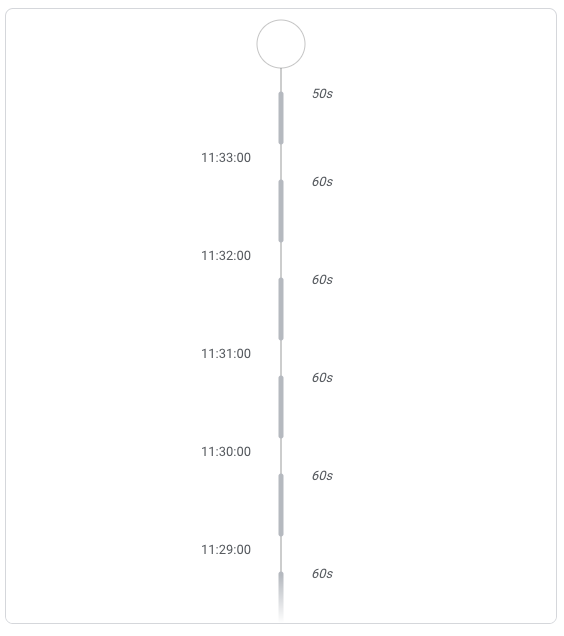
2. Second Stream
The secondstream provides a more detailed overview of events. From this you can extract the most important information. Clicking on an event in this block opens a block of parameters. Here you can find all the parameters associated with the selected event.
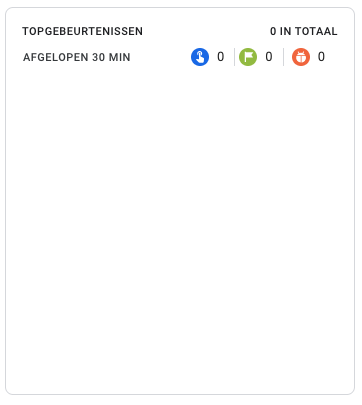
3. Top events
In the top events block you can see an overview of all events that have taken place in the last 30 minutes. This block is interactive, which means you can click on the events for more information.
4. Device troubleshooting
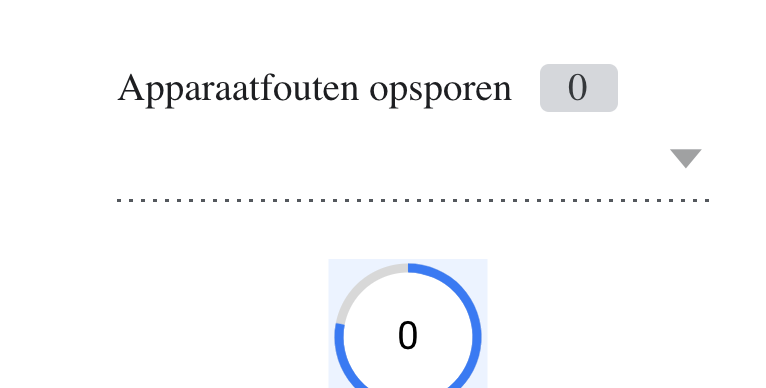
Under Device debugging, you will find the various devices for which debug data comes in to the DebugView.
Activating Google Analytics 4 DebugView
Activating the GA4 DebugView can be done in two ways. Both ways require a Google Tag Manager implementation with a GA4 configuration tag. Don't have a Google Tag Manager on your website yet? Then make sure this is implemented first and that Google Analytics 4 is loaded via Google Tag Manager before moving to the next steps.
Method 1: Google Tag Manager sample feature
If you use the preview function in Google Tag Manager then this data automatically becomes visible in the DebugView.
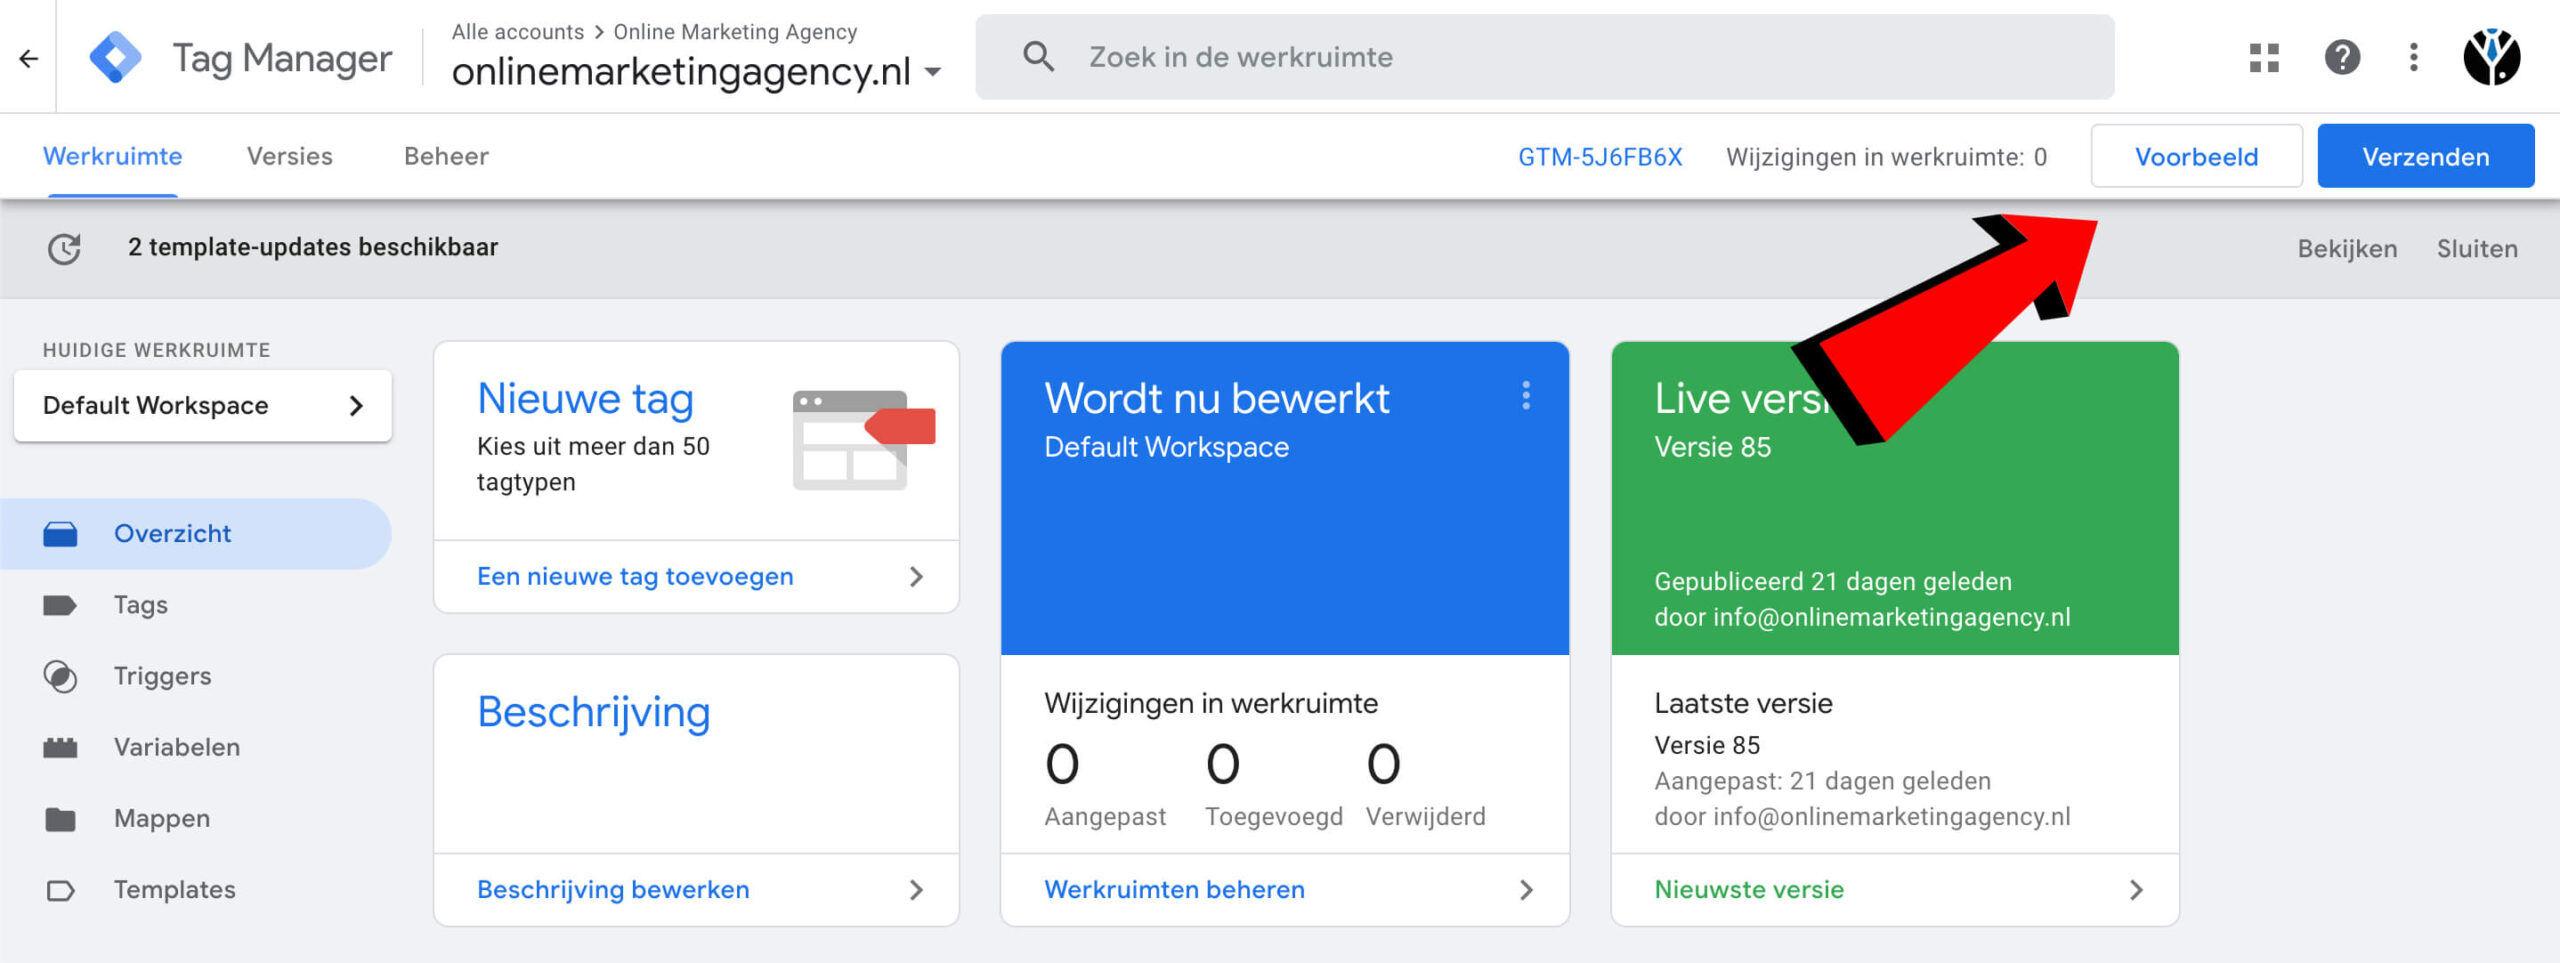
You do not have to publish any changes made in the Google Tag Manager workspace yet. You can quietly test everything in the GA4 DebugView first. Does everything come through properly in Google Analytics 4? Then don't forget to still publish the workspace.
If you have a website with many visitors, then I recommend using this method. This is because with this method, the DebugView is only visible to your own traffic from Google Tag Manager's preview mode.
Method 2: Debug_mode event parameter
If you want to use DebugView without the preview function within Google Tag Manager, you can add the event parameter debug_mode to tags within Google Tag Manager.
Method 2.1: GA4 configuration tag
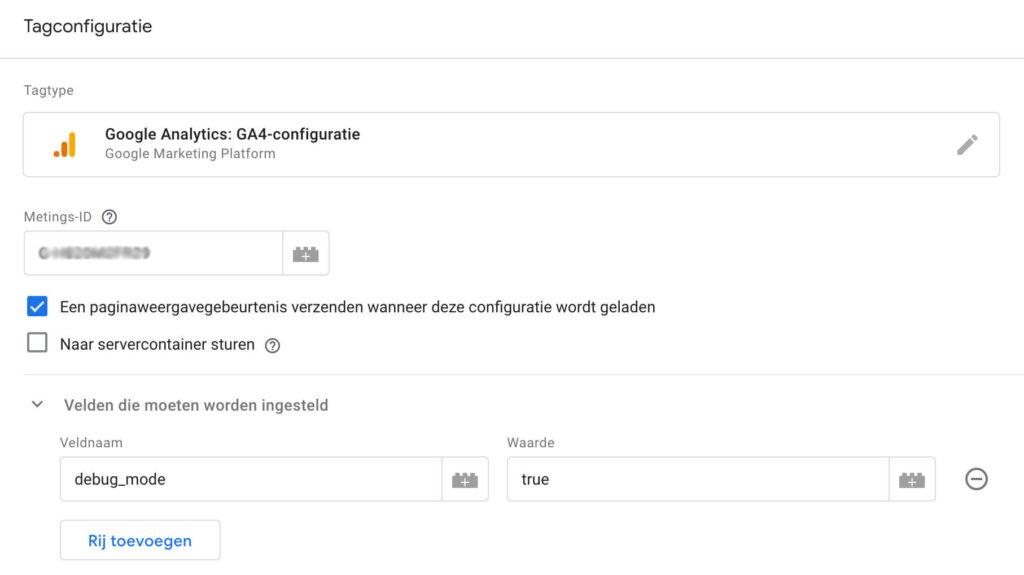
If you add the event parameter to the GA4 configuration tag, you ensure that all created events are automatically included in the DebugView data. You add the event parameter as follows:
- Within Google Tag Manager, open the GA4 configuration tag.
- Open the block under "Fields tobe set.
- Click "Add row.
- For Field name, enter debug_mode and for value true.
- Next, don't forget to publish the workspace.
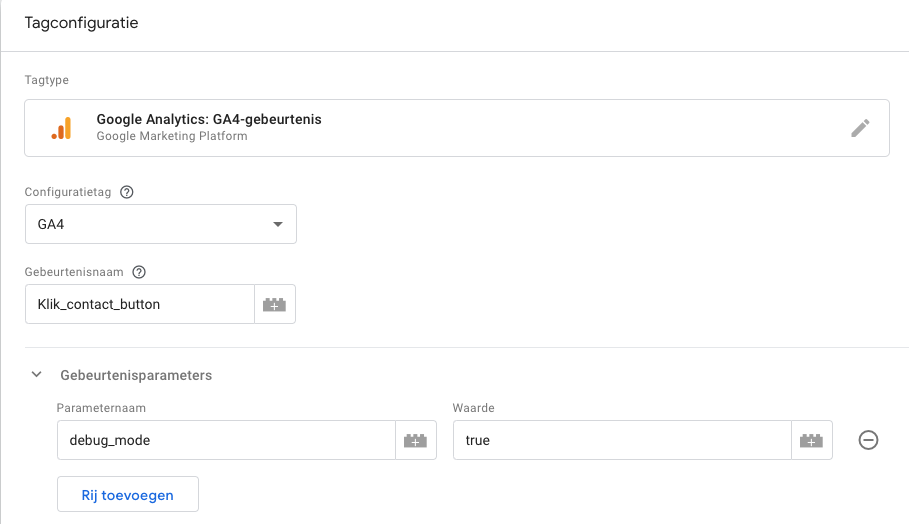
Method 2.2 GA4 event tag
Want to use the DebugView only for one or more specific event? Then add the event parameter debug_mode to the GA4 event tag. You add the event parameter as follows:
- Within Google Tag Manager, open the GA4 event tag.
- Open the block under "Event Parameter.
- Click "Add row.
- For Field name, enter debug_mode and for value true.
- Repeat for all the events you want to measure in the DebugView.
- Next, don't forget to publish the workspace.
Using the GA4 DebugView
Now that we have everything set up correctly and know what the DebugView consists of, it is time to actually start using the DebugView. We start by looking up our own device that we are going to run the debug with.
Selecting the right device
Did you use the debug_mode = true implementation method? Then under Device debugging, find the device you are using to test.
If you are using the preview function of Google Tag Manager then this is not necessary because only the traffic from the preview function is returned in the DebugView.
Personally, I usually check the device by going to a page that not many people visit. For example, the page that contains the privacy statement. Then look at the different devices and click on the page_view > parameters > page_locations event within the DebugView to find out if the device in the DebugView is yours.
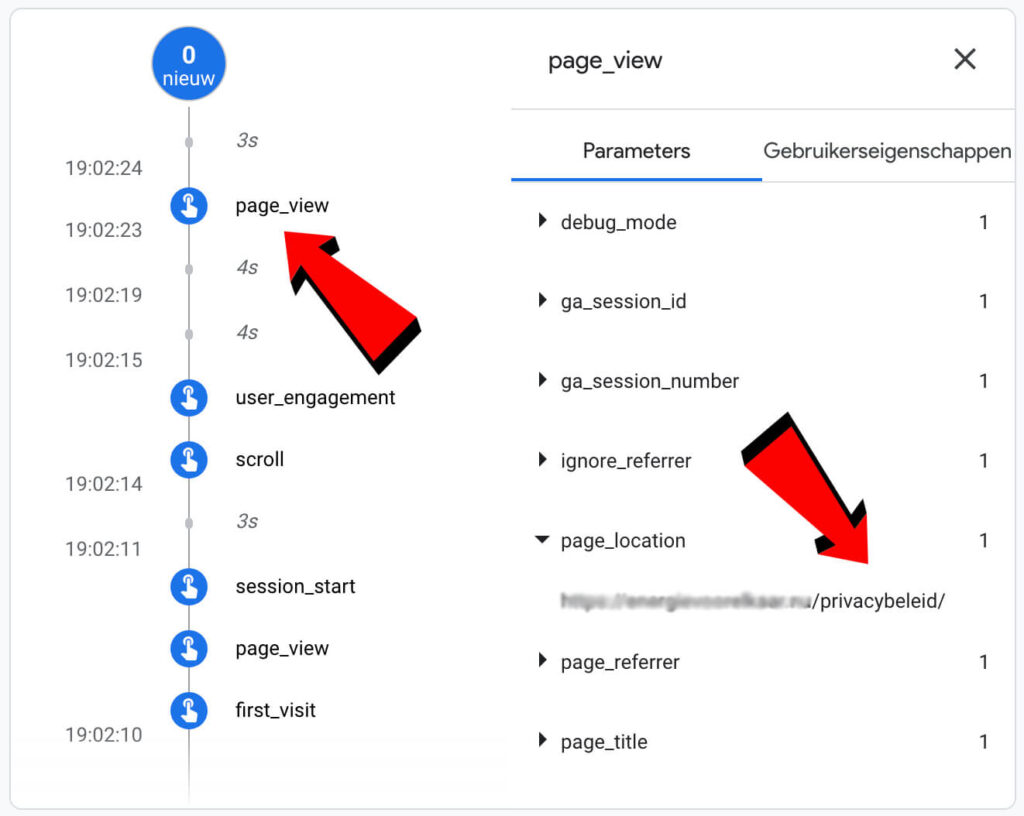
Note! There is always a few seconds delay in the DebugView. So always wait a few seconds after you trigger an event.
Checking events and conversions
As an example for this article, we are going to see if the conversion click_mailaddress (set in Google Tag Manager) comes through properly in GA4. As I mentioned, the secondstream is the most important element to check if you have everything set up correctly.
First we make sure we have selected the correct device under Device Error Detection. If this is the case we make sure the conversion is triggered. So in this case we click on an email address.
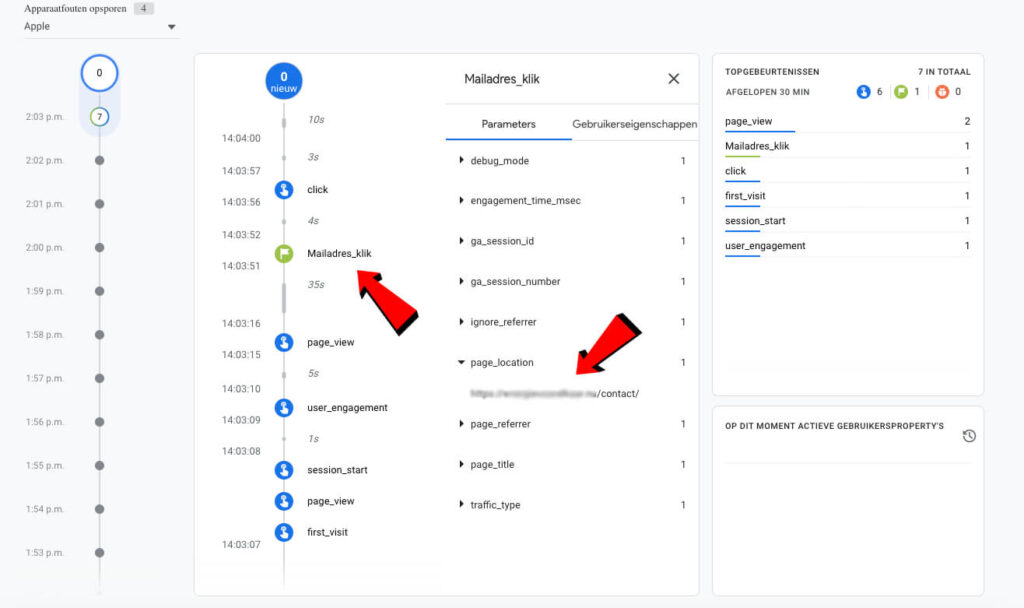
In the second stream, you can see that there is a distinction between blue and green. Blue is an event and green is a conversion.
As can be seen in the image, the conversion click_mailaddress returns once. This means that the conversion is being measured properly.
GA4 Disable DebugView
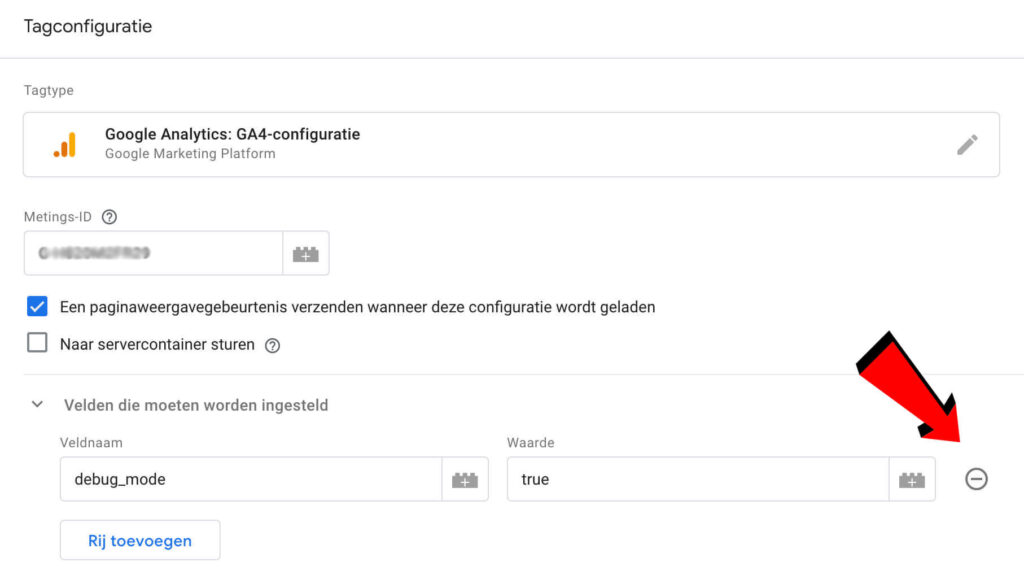
To disable the DebugView again, you need to remove the event parameter completely from the configuration or event tag. You do this easily by clicking on the minus sign in Google Tag Manager, behind the added field with debug_mode and true . Note! Changing the value from true to false does not work.
Common problems with the GA4 DebugView
If the GA4 DebugView is not working for you? And by that I mean that you don't see any data in the GA4 DebugView, please check the points below.
Implementation
Don't see any data coming in to the DebugView? If so, check the deployment method. Did you publish the Google Tag Manager workspace (with the debug_mode = true)? If not, do so anyway and you will see that the DebugView works.
Filters
Before getting started with GA4's DebugView, always check to see if any internal traffic filters or developer filters are active. Is there a filter active? Then your own traffic to the website may not be measured. Not even in the DebugView.
Browser extension
There are certain browser extensions that block Google Analytics. Therefore, try disabling all browser extensions and see if you then see your device reflected in the DebugView of Google Analytics 4.
Right device
Do you see debug data coming in but do not see your own events in the DebugView? Then check that you did select your own deviceat detect device errors .
In conclusion
Google Analytics 4's DebugView is a great feature to instantly check that your measurements are coming in as you set them up.
Still have questions about Google Analytics 4's DebugView? Let us know!
What is GA4 DebugView and how can I use it?
DebugView is a feature within Google Analytics 4 (GA4) that allows you to test and debug the implementation of GA4 on your website or mobile app. GA4 DebugView allows you to view real-time events, events and event parameters to ensure they are captured correctly and transferred to GA4.
How can I enable GA4 DebugView in my Google Analytics 4 account?
To use GA4 DebugView, you must first have access to a Google Analytics 4 account and have administrator privileges. After enabling GA4 DebugView, you can view events and parameters by going to the reports and filtering the data. This will give you a real-time view of the data in GA4.
What are the benefits of using GA4 DebugView?
There are several advantages to using DebugView:
- Real-time insight - This allows you to view real-time data of events and parameters sent to GA4.
- Troubleshooting - DebugView also provides detailed error messages and alerts for any problems.
- Testing implementation - DebugView allows you to test the implementation of GA4 on your website or mobile app before taking it into production.


Written by: Tom Boenders
Tom is Teamlead SEA at OMA. When it comes to top positions in Google, he is the first to give advice. Solicited and unsolicited.