Menu
Table of contents
In this tutorial, I'll explain how to make scroll depth on your website measurable in Google Analytics 4 via Google Tag Manager and how to add scroll depth to your reports.
Disable default scroll tracking
If you have enhanced measurement (enhanced conversion) enabled then Google Analytics 4 captures a scroll event every time visitors reach the bottom of a page (when 90% of the vertical scroll depth is visible). Since we are going to measure scroll depth more accurately via Google Tag Manager we can turn off the default scroll event. You can do this in Google Analytics 4 by going to Manage -> Data Streams and choosing the data stream. Then click on the cog icon.

Next, flip the slider on Scrolls.

Scroll variables Google Tag Manager
Now that we've turned off the default scroll event in Google Analytics 4, it's time to switch to Google Tag Manager for the technical part. Fortunately, this is not too bad.
First, we need to turn on some scroll variables. We do this within Google Tag Manager at Variables -> Configure. Then under the heading Scroll, check all variables.

Scroll trigger
For the trigger, we will use the default trigger called Scroll Depth. Check the checkbox depths for vertical scrolling and then enter the scroll depths in percentages you want to track. The settings will then look as follows.
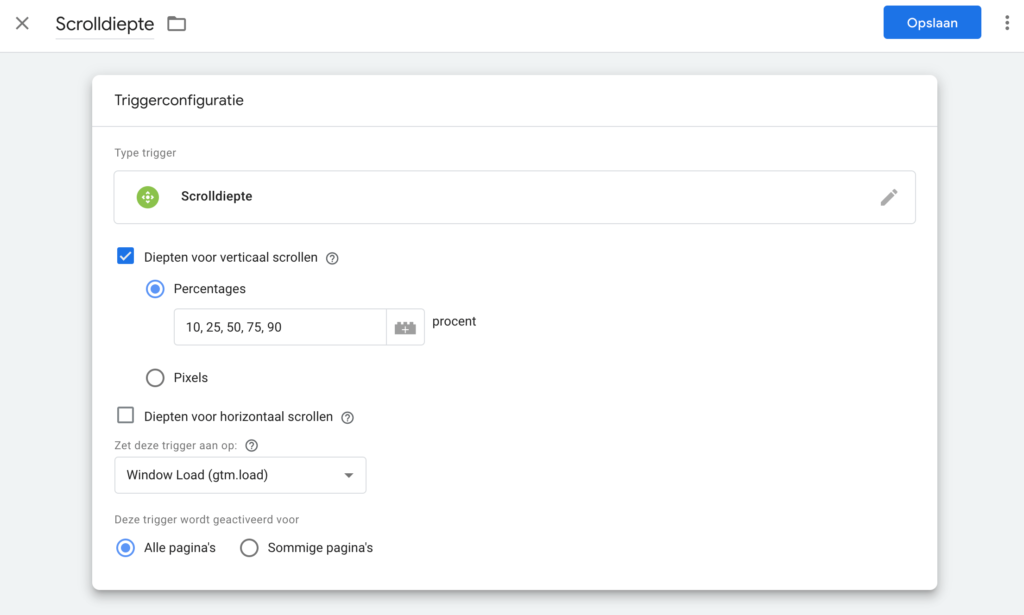
Should you want to measure scroll depth only on some specific pages, you can choose some pages instead of all pages . Here you can then set a conditions for the trigger.
Set Tag
Now that we've created the trigger, it's time to set up the tag. Here I am assuming that you have already set up Google Analytics 4 through Google Tag Manager. Is this not the case? Then take a moment to read the following article: Google Analytics 4 loading Tag Manager.
For the tag, we will use the GA4 event tag. Add a new tag and choose Google Analytics: GA4 event.
Under Configuration tag , select the set Google Analytics 4 configuration tag. Next, under Event Name , enter Scroll_{{Scroll Depth Threshold}}. Make sure to add the Scroll Depth Threshold variable via the lego block icon.
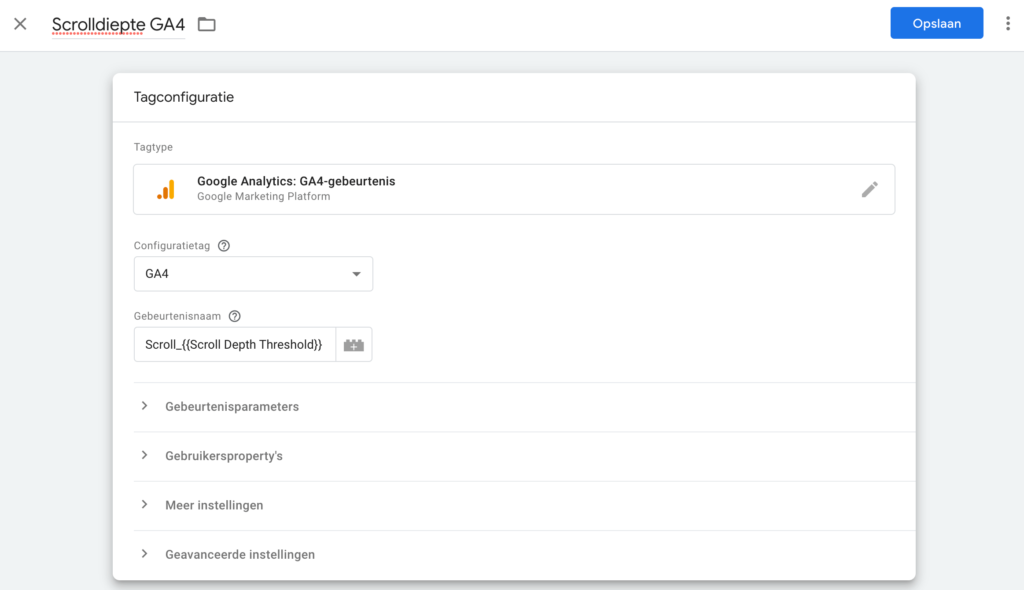
The above settings cause a separate event to be measured when scrolling past each specified percentage. For example, if a visitor has visited 50% of a page then you will see an event called Scroll_50 in Google Analytics 4.
Testing!
Now that we have everything set up, it's time to test if everything is working. We do this by opening the website in the preview mode of Google Tag Manager. Then scroll down on the website to make sure that some of the scroll percentages specified earlier have been achieved.
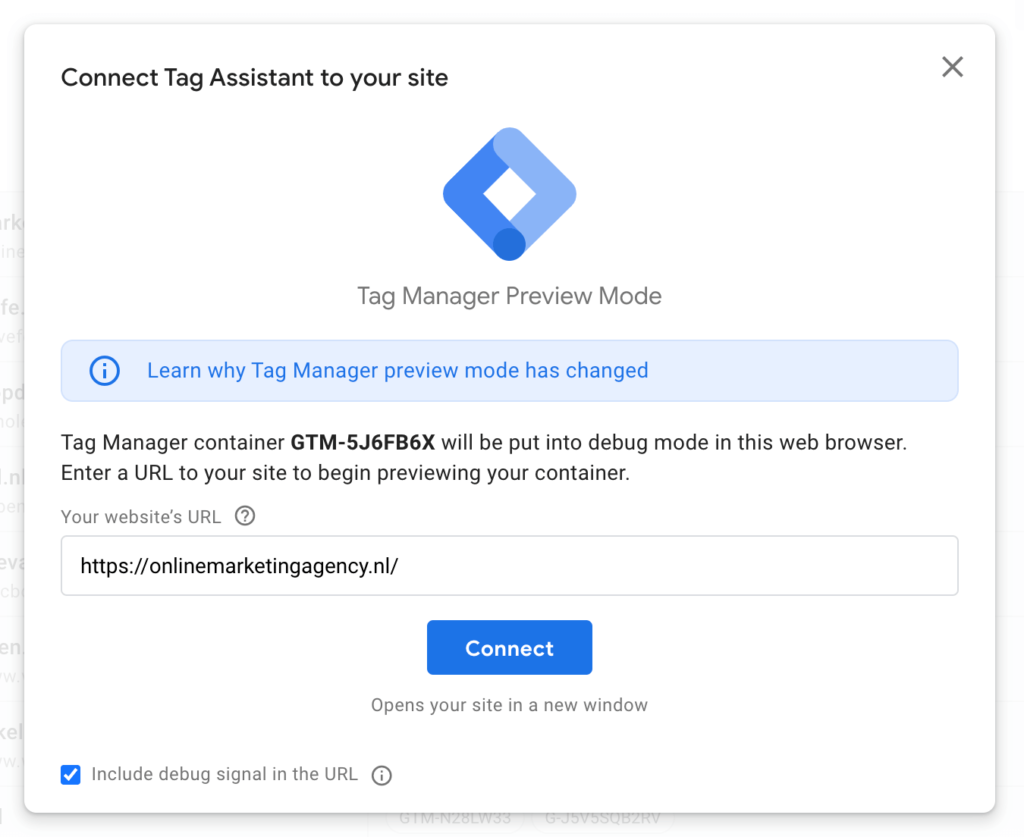
Now look in Google Tag Manager to see which tags have been fired. If everything is set up correctly, the Scroll Depth tag is among them. To check if the values of the percentages have come through correctly, click on Scroll Depth on the left side of the bar and then on the fired scroll depth tag.

Now select Values at the top right and check the event name.
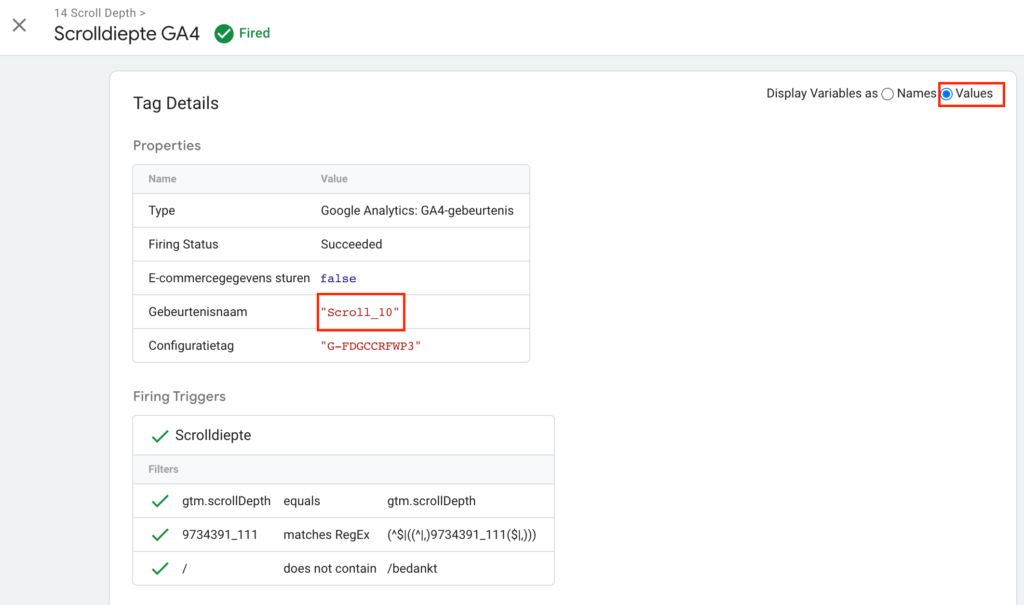
If everything works, we can publish the customizations in the Google Tag Manager container.
Testing debug view Google Analytics 4
To test whether everything from Google Tag Manager comes through properly in Google Analytics, we use the DebugView in Google Analytics 4. To do this, go to Manage -> DebugView. Then at the top under Device Error Detection, find the device you are using to test.
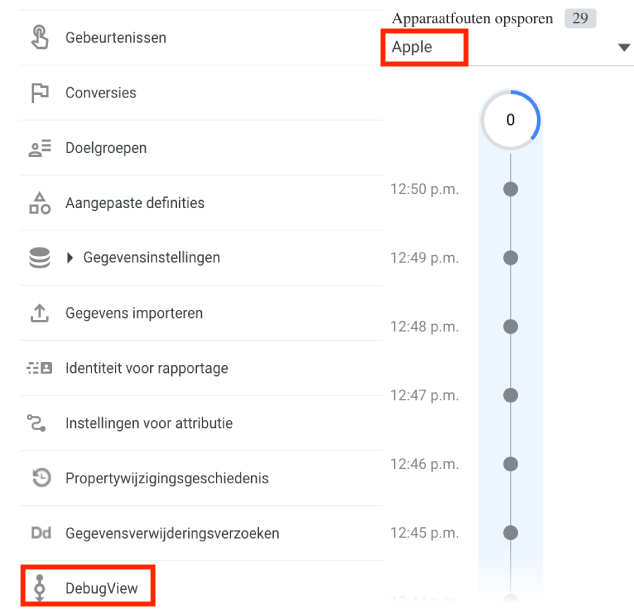
Once you've found your own device, it's time to scroll the website. If everything is set up correctly you will now see scroll events appear in the DebugView.
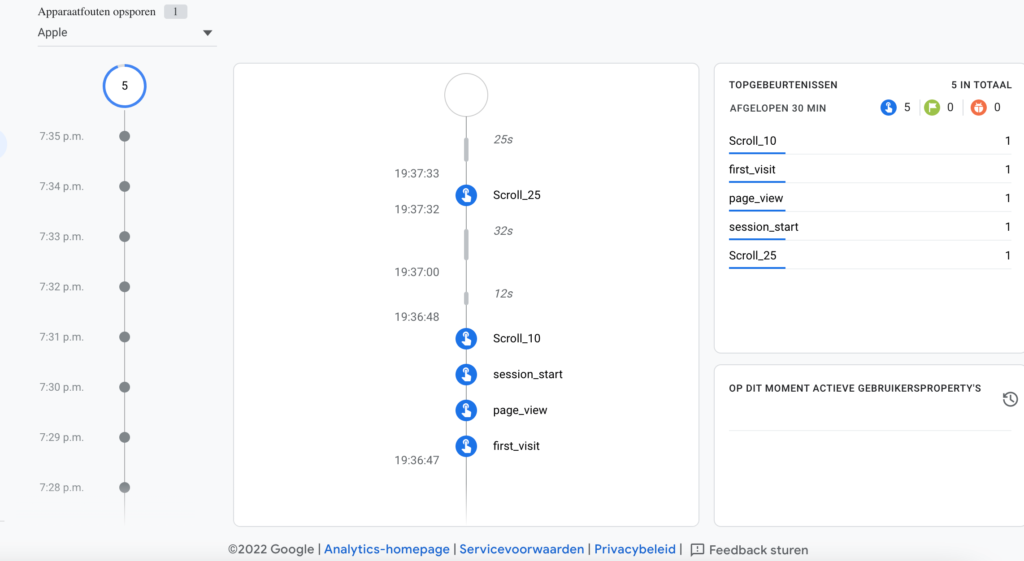
Note that there is a delay in the DebugView, so it may take some time for your actions to be visible.
Important! In the DebugView, check the set conversions as well. If you have set up a thank you page in Google Analytics 4, then it may register as a conversion with every scroll event. Obviously you don't want this. The solution is to add 'event_name equals page_view' to the thank you page event.

Add scroll depth to your reports
Well, now that scroll depth is correctly measured in Google Analytics, you naturally want to incorporate it into reports.
Scroll depth in Google Analytics 4
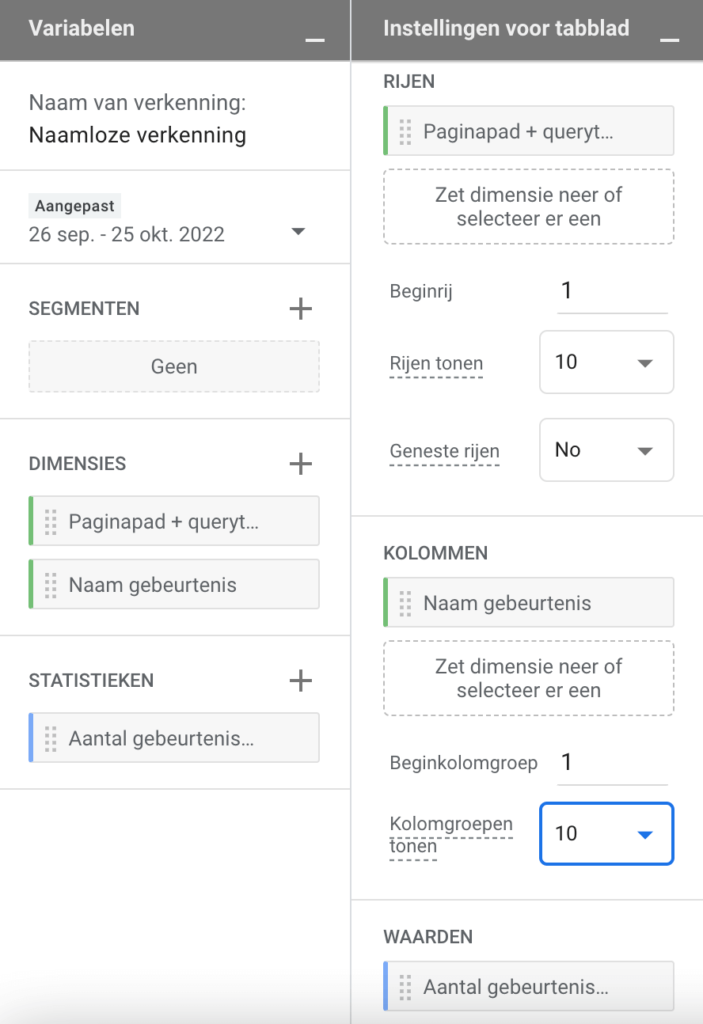
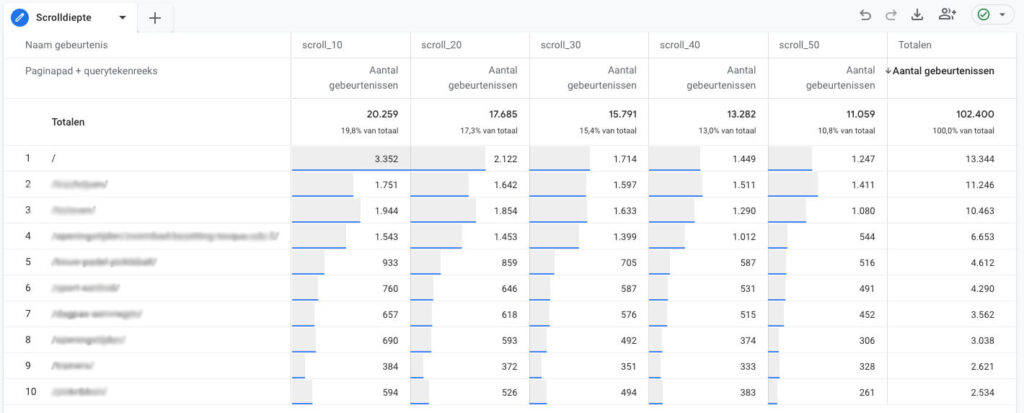
Within Google Analytics 4, we do this using an exploration. Go to Explore and add an empty exploration.
Then click '+' next to dimension and import Add Page Path + query string and Name event . Then under statistics, import the Number of events.
- Drag Page path + query string to rows.
- Drag Event Name to columns
- Drag Number of events to values
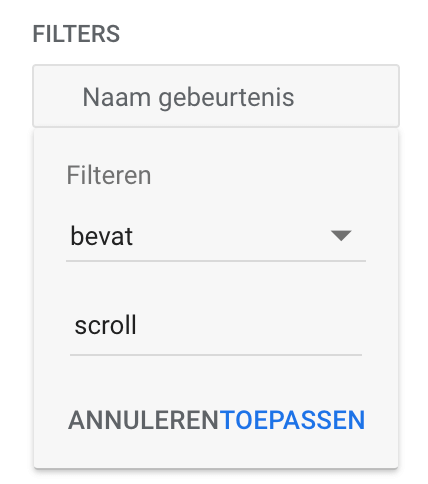
Finally, add a filter for Name event contains scroll.
You now have insight into the scroll depth per page.
Scroll depth in Google Looker Studio
Are you using Google Looker Studio (formerly Google Data Studio)? Then use a Diagram, select Event Name under Dimension and Number of Events and Total Users under Statistics .
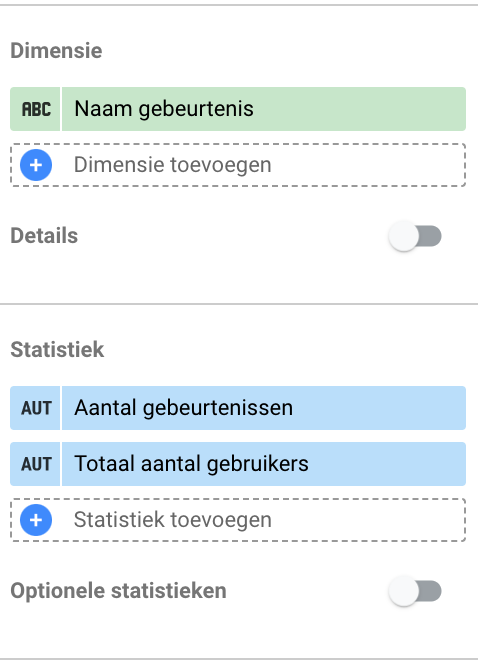
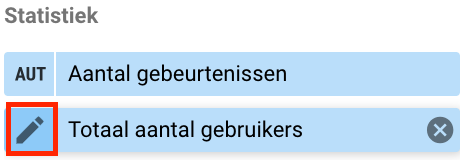
Use the Total Number of Users statistic to express the percentage of visitors who achieved a certain scroll depth. To do this, select the pencil of from Total Number of Users.
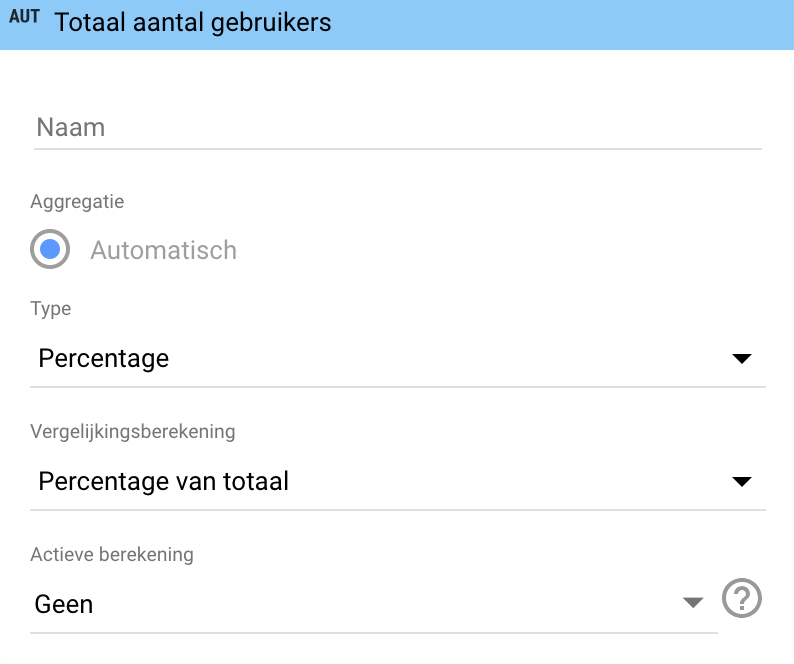
Then under comparison calculation , select -> Percentage of total. You will now see percentages appear, these percentages indicate the percentage of total users who have reached a certain scroll depth.
In addition to the scroll depth events, you will also see other event names reflected in the diagram. To ensure that we see only the scroll depth event names we need to add a filter with the settings below.

Note: To be safe, check your events for the naming of your Scroll events. Keep in mind that this filter is case-sensitive. Similarly, the naming convention for your scroll events may contain "Scrolll_[number]". In that case, your filter should contain the name "Scroll." Otherwise, you will no longer see any events in the overview.
The final step is to add a control for selecting the page you want to view the scroll depth for. To do this, add a drop-down menu, using the three vertical dots in the toolbar menu.
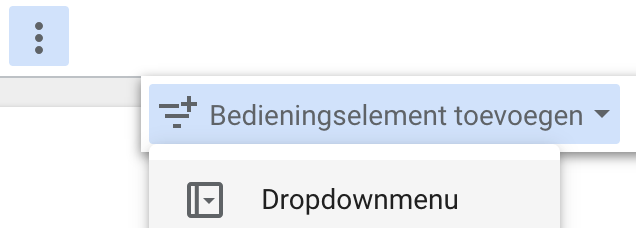
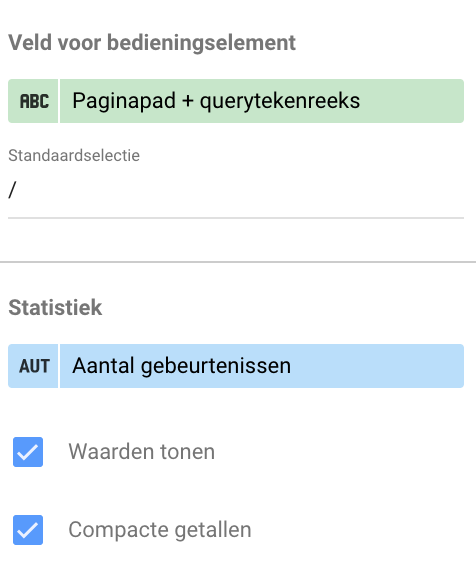
At control element field, add Page path + query string and at default selection, enter a / (homepage). Under statistics, select Number of events.
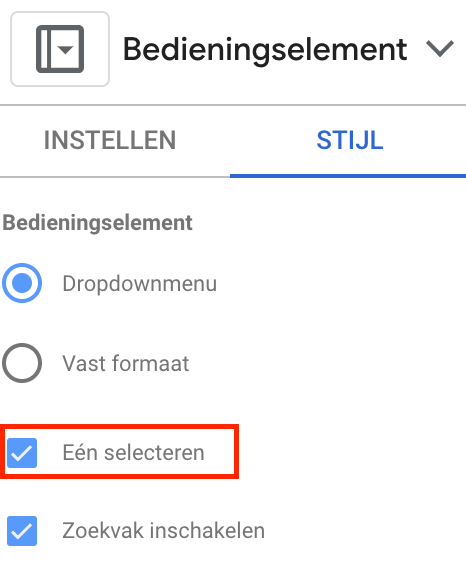
Then under Style, check the Select One box and you're done.
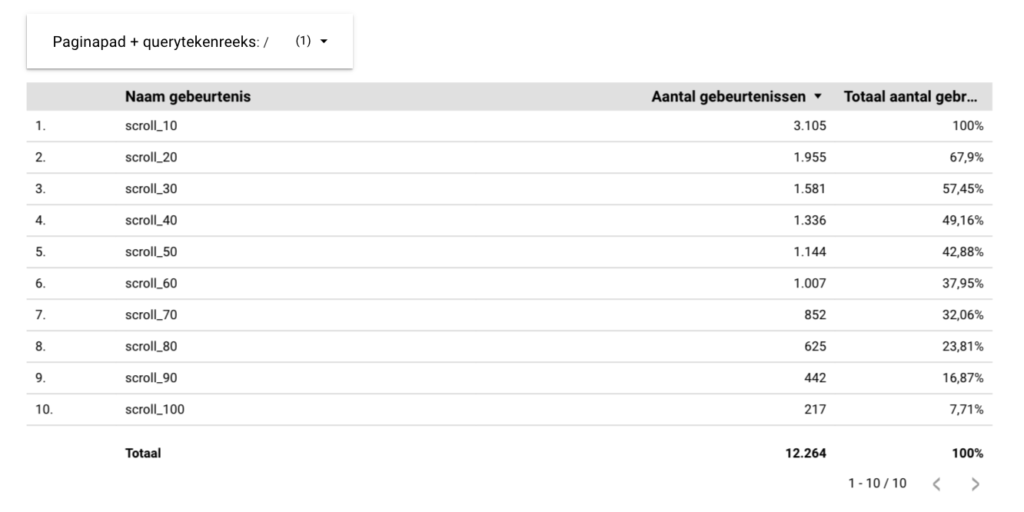
You have now created a chart in Google Looker studio where you can see the preset scroll depths achieved by visitors for each page.
Time for conclusions
Now that you've made scroll depth measurable in Google Analytics 4 and added it to your reports, it's time to analyze how many visitors see the most important elements on your pages. Good luck!





Written by: Tom Boenders
Tom is Teamlead SEA at OMA. When it comes to top positions in Google, he is the first to give advice. Solicited and unsolicited.